Four Seasons
The weather is where it all happens with everyone and everything totally dependant on what happens in the atmosphere. The weather is more important than the soil, more important than niche habitats, as it determines what chemical reactions occur in the soil, it influences the very niche that a plant grows in. Tides are responsible for weather movements and weather patterns. If you are new to an area it is vital you understand a little of the patterns and seasons as these will ultimately affect your decisions on what to plant and where to plant your new treasures.
Oxygen which oxidises minerals so that they are soluble in water, Nitrogen forms nitric acid and ammonium so plants the building blocks of life can start the foundations, and Carbon dioxide which is so vital in the process of simple sugars which are then transformed in to complex carbohydrates which sustains every living organism. The tides the salinity levels of rills, creeks, streams, rivers, lakes, bays and oceans are all dependant to some degree on the weather.
Before we start we have used the terms BSL and ASL with every plant. This is the level a plant is naturally found below sea level BSL or above sea level ASL.
The sea level is taken at the mean sea level. Simply put this is the datum point represented by the half way point of the ocean ‘s surface over a long term duration. That is the halfway point between the average high tide and the average low tide readings. This is not an accurate point as with global warming the oceans are rising and in stable positions around the world the average increase has been 20mm over the past 100 years. This increase is also expediential meaning that the increase has been more rapid in recent years. Where as Lake Ayre was 17 meters below sea level 100 years ago it is now 17.2 meters below sea level now and is likely to be 17.8 meters or more below sea level in 100 years from now.
The sea level is in fact more complex than this as it varies greatly over time even within a given area. Historically, adjustments were made to sea level measurements to take into account the effects of the Metonic Cycle (235 lunar month) and the Ecliptic Cycle (223 month) on the tides.
In fact I would be best using LMSL or Local Mean Sea Level which is O.K. if Australia was a small Island but it isn’t. To use the LMSL in Darwin is certainly different than utilizing the LMSL in Port Phillip Bay. Using a generally accepted altimeter reading set at a post office is another method which is more universal and acceptable for general readings. I would like to be more precise than this but it is impossible.
Temperature:
The temperatures on this map are based on the years 1900 to 2010 where records were kept or from the time records were kept for an individual area. The map is subject to human error and the limited number of places where long term records were available. I believe it is still the best available for accuracy but does have limitations.
Temperature is affected by topography even over short distances. This was well noted in the Coffs Harbour district where Coffs Harbour’s temperatures are recorded at 7 degrees and 27 degrees. This is the normal variation of average lows and average highs per annum yet Nana Glen which is only 20 kilometers away as the crow flies varies considerable more with average lows of around 1 degree in July August to 31 degrees in January. There is a gradual decrease in day time to evening temperatures in Coffs Harbour where as Nana Glen the temperatures drop rather quickly late in the afternoon to dusk especially in the drier months of the year.
The average temperatures for the second 50 year period were higher than the average for most centers compared to the previous 50 year period through out Australia. I have included this map because it gives the average summer temperature figures for an area but with Global Warming it may become obsolete within a decade or two.
Mean Average December Maximum Temperatures.
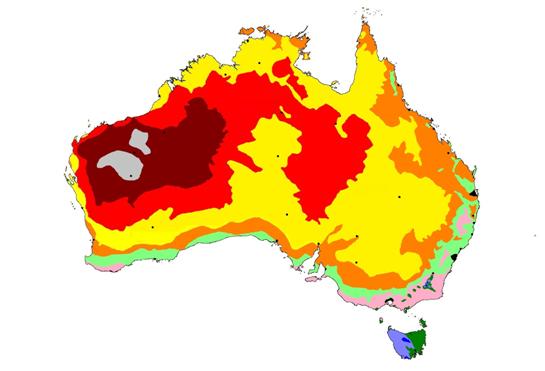
43 plus degrees
39 to 42 degrees
36 to 38 degrees
33 to 35 degrees
30 to 34 degrees
27 to 29 degrees
24 to 26 degrees
23 to 25 degrees
22 to 24 degrees
19 to 21 degrees
Mean Average August Minimum Temperatures.
12 plus degrees
10 to 12 degrees
8 to 10 degrees
6 to 8 degrees
4 to 6 degrees
2 to 4 degrees
0 to 2 degrees
-3 to 0 degrees
-6 to -3 degrees
Below minus 6 degrees
Average Annual Lowest Temperature.
This map is useful for deciding which plants will grow in your area but not which ones will thrive and flower. Plant hardiness maps allow producers to label their plants as being suitable for particular areas, and, in theory at least, these results in happier customers who can be more confident in purchasing and growing plants that will survive in their locality. Early in 1990 the United States Department of Agriculture (USDA) published an updated version of their map of plant hardiness zones. These zones of course only apply to plants growing out of doors with no protection, but which are provided with adequate water.
Such a map would be useful for Australia as it would be a satisfactory method where a quick reference to where a plant may be suitable. Nothing will out strip local knowledge of geographical variations in temperature and humidity. This would be an aid to those Australians setting up their first garden or new comers to the district, as well as helping exporters to the USA describe the hardiness of their plants in a common language. Similar maps have been drawn before, such as those on the back of many seed packets, but as far as I know none has ever been comparable with the American system.
The statistic used by the USDA is the average annual minimum temperature. This is the mean average, over ten or more years, of the very lowest temperature (the absolute minimum) observed for each year for each meteorological station. I prefer to call the USDA term the average annual lowest temperature.
I have used the same statistics for Australia, but rather than use US zones directly I have modified the limits for each zone. This is because Australia, in winter, is much warmer than most of North America in winter, so the lowest US zones aren’t needed. All of Australia (excluding Macquarie Island) is covered by just over four US zones (7b to 11). To make the map more useful to Australians I have created 7 zones to fit our climatic range, and used metric units. The limits to each zone, and a comparison of US and Australian zones, are shown alongside the map. This will assist Ex-Pats and Americans setting Australian Native Gardens in America. Initially I tried subdividing each zone (except for 7), to a total of 13, but it proved too difficult to map these on a scale suitable for internet publication.
As might be expected, the main factors determining average minimum temperature are altitude, latitude and proximity to the coast.
Zone 1 covers the alpine areas of south eastern Australia.
Zone 2 the tablelands of south east Queensland, New South Wales and Victoria, and the uplands of central Tasmania.
Zone 3 includes much of the southern half of the continent, except for localities on or near the coast. Many of our weather stations are on the coast or on off-shore islands (some of them are lighthouses) and these are often a zone or two higher than adjacent mainland stations because of the warming effects of the ocean in winter.
Zone 4, because of this warming effect, covers a broad area from coastal Queensland across the continent to Shark Bay and Geraldton in the west, also includes the Mornington Peninsula, areas adjacent to Spencer Gulf and Adelaide, the south western coastal zone, Sydney and the north coast of NSW, along with a number of localities dotted all around the southern coast of the continent.
Zone 5 covers, some of the Queensland coast, Western Australia north of Shark Bay and across the top end.
Zone 6 includes the Queensland coast north of Cairns, Cape York Peninsula and the coast of the Northern Territory.
Zone 7 is mainly restricted to islands off the north coast.
There are many problems with maps of this type. For example, the spread of weather stations is insufficient to give good resolution of the zones and too many places with different climates are lumped together. In Australia we have only 738 stations with a record of more than ten years. This is one station per 98,491 hectares! Admittedly, the more populated areas have relatively fewer hectares per station but the basic problem remains. Even worse are the problems of local factors such as aspect, altitude, proximity to the water and even soil type. For example, Mt Isa has three climatic stations with more than a ten year record. One is in Zone 4a, one in Zone 4b and the other is in Zone 5a. Sydney residents can choose between Zones 3a to 4b depending which station is used. Most other cities have similar problems. Everyone is aware that different locations in the same city or suburb are suitable for different plants but it is hard to quantify these differences and even harder to draw a meaningful map. There may even be a case for publishing a list of weather stations and their zone Classification so that people can decide for themselves which is the most appropriate location to use for their local conditions.
Plant hardiness refers to their ability to survive the conditions of a particular location, including tolerance of heat, soil moisture, humidity and so on. This map is based only on how well they survive low temperatures in winter. Even that is a grossly over simplified. For example, are plants affected more by a single extremely low temperature night, or is the number of days of frost (the duration of winter) more important? In fact both are important, but the statistic for the map only relates directly to the former. Another limitation is that often plants will survive in an area for some time, but every now and then there will be a catastrophic cold snap that will kill them. Some risk evaluation – the probability of getting a particularly severe low temperature – often would be more useful for each locality rather than the average conditions.
Low temperature is not the only determinant of plant survival. Other environmental factors such as high summer temperature, humidity, soil temperature, etc. may be equally important. Also, many plants will survive in a locality but won’t flower if the day length is inappropriate or if they require vernalisation (a particular duration of low temperature). The low temperature statistic is only appropriate for woody perennial species, and even then its use is limited. With annuals the time of planting can often be adjusted to allow growth beyond their normal geographical range.
The map is thus only useful as a very broad guide. It needs interpretation that takes into account factors other than low temperature that limit plant growth as well as local knowledge.
An alternative system for describing plant hardiness is to use indicator plants (the USDA also publishes a list of these to go with their map). Common plants with known limits to their range are generally used for this purpose. For example, many people will know whether lemons will grow in their locality. If you then say Geraldton Wax will grow more or less where lemons will grow you have defined the range of Geralton Wax with some accuracy (whether or not it will flower is another story). Unfortunately no two plant species seem to have exactly the same requirements and even within a species there are differences. ‘Meyer’ lemons, for example, are more cold tolerant than ‘Eureka’. You can really only define core areas and they are often very arbitrary.
At some time in the future I think we will probably get around the problems associated with plant/climate maps with much more sophisticated database systems that combine complex climate statistics and advanced plant growth models. There are already software packages available to help you select landscaping plants. Two that I have seen are the ‘Grow What Where’ computer version, published by The Australian Plant Study Group, and ‘Plant guide’ from Arbor data. However, these have limited climatic inputs. You are asked, for example, to select between fairly vague zones such as ‘warm temperate’ or ‘eastern tablelands’. Climatic data bases that allow you to assess the chances of particular climatic events taking into account some local factors (e.g. what are the chances of getting more than five consecutive nights with temperatures lower than -10°C on a south facing slope in Canberra?) combined with data bases containing detailed knowledge of plant responses to their environment (eg. how many nights of frost can Pandorea jasminoides survive?) will go a long way towards answering the question of what grows where.
In the near future, when the customer asks if a particular plant will grow in their garden, the retailer will probably turn to a computer, not a map, to find the answer. Until then the best method of determining whether a plant is suitable for your area is to notate the plants that are thriving in your neighbour’s yard, in your immediate locality or in the bush under similar conditions to your garden. This will determine the best natives which are most suitable for your locality.
Rewritten from an article written by Iain Dawson, 1991. Australian National Botanic Gardens.
Global Warming Fact or Fiction?
The question on every ones lips is Global warming real of fiction and if it is real what are the consequences of its warming? The consequences to the environment and agriculture are discussed in chapter 19 of “Botany the Science of Plants”
Here I will look at a few of the fallacies often perpetrated by those opponents of facts and place the existing facts that are there as evidence before you.
* “The world has been cooling since 1998.”
The temperatures have been going up and down slightly, but the variation is overlaid on a clear upward trend between the lower and upper temperatures. That is the medium, cooler and warmer temperatures all show a significant upward trend. Since regular temperature records began in 1850, 14 of the past 15 years have been the hottest on record. The last quarter of the 20th century temperatures rose by 0.5 degrees. In 20 years of the 21st century temperatures have risen an average of 0.6 degrees.. The rate at which the world is warming is also unprecedented: Air samples from bubbles trapped in ancient ice samples from both the North Pole and South Pole, and cross-checked with other samples, show temperatures are rising faster than at any time since modern humans appeared. Stalactite and stalagmite samples tested in China also support findings from polar ice.
History locked up in ice & limestone- longer than human existence on Earth are solid, undisputed evidence of climatic time line changes.
* “The world maybe getting warmer but we don’t know the real cause.”
The causes of global warming are not absolutely certain, but the overwhelming majority of researchers, working independently worldwide, using different models and different data, have been coming to the same conclusions for over two decades. The Intergovernmental Panel on Climate Change has reached the conclusion that it is “virtually agreed with certainty” that human activity is the main cause of climate change; that is, there is a certainty “greater than 99 per cent”. Very few scientific theories approach that level of certainty.
The tree of knowledge: There is consensus that human activity is the main driver of climate change, and that cutting greenhouse gas emissions along with reforestation are the only ways of slowing it.
* “Climate change is caused by solar activity not by human activity.”
Changes in radiation from the sun affect Earth’s climate, as do oscillations in the Earth’s orbit. But since the 1970s, when temperatures increasingly rose beyond the normal, both the sun’s energy output has been in a declined phase and the Earth’s orbit has been in a stable phase. The changing patterns of solar activity are included in all climate models.
It’s common knowledge that the Sun undergoes an 11 year long cycle. Such a reduced activity has astronomers thinking, because we are nearing the point of the lowest ever recorded statistically on solar activity since 1913, when the Sun lit without a sunspot for 311 days. According to Dean Pesnell; who is a solar physicist at Goddard Space Flight Center, “The Sun is experiencing a very deep solar minimum of activity. This is the quietest sun we’ve seen in almost a century.
We’re just not used to this kind of deep calm, Marshall Space Flight Center sunspot expert David Hathaway adds. “It’s important for scientists to be prepared when the next solar maximum hits and while an intensification in solar activity is only expected to take place three to four years from now, the “silence” we are experiencing at this point is suspiciously calm.”
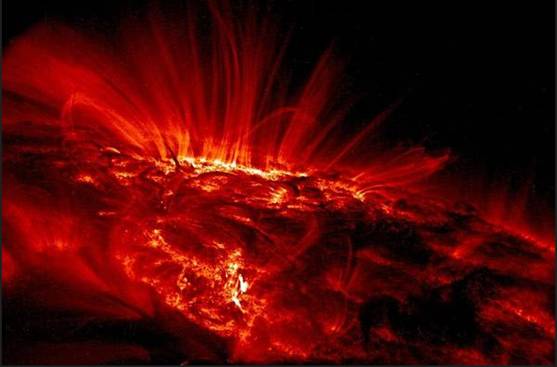
Photo by http://news.softpedia.com/news/The-Sun-Is-Awfully-Quiet-These-Days-108449.shtml
* There is no consensus among scientists
There is clear consensus in the world scientific community, and in Australia, that human activity is the main driver of climate change, and that cutting greenhouse gas emissions is the only way of slowing down the consequences and the intensity of its affects. This is now the view of all the world’s leading national science academies and institutes. This does not constitute a unanimous view, however, with just an isolated handful of individual scientists believing it is too early to be sure the overwhelming consensus of scientific evidence is in and it all points in one direction.
* Why believe long-term predictions when meteorologists cannot even say if it will rain next week?
Climatology takes a step back from day to day meteorology predictions and looks at longer term patterns. For a start meteorologists are far more accurate than what skeptics give them credit for. Numerous independent studies have concluded that carbon dioxide and other heat-trapping gases placed into the atmosphere by humans is the new variable causing climate change. Climate models have been repeatedly tested and shown to accurately simulate climate scenarios.
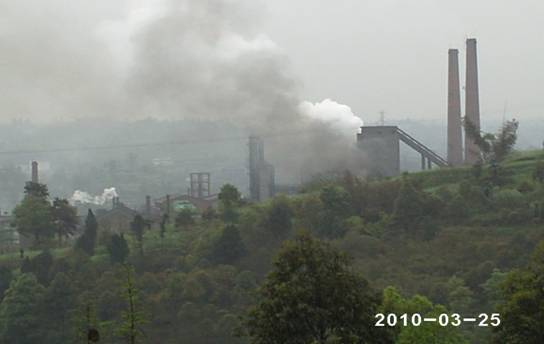
One of the dirty sides of fertilizers world wide – Carbon Dioxide & Sulfer dioxide emissions.
* ”Human emissions are smaller than natural emissions, so cannot be blamed for climate change”
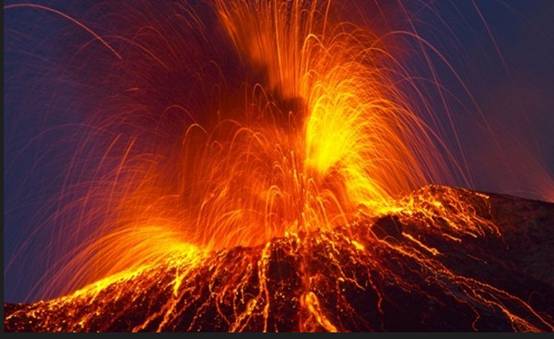
Rotting vegetation releases far more greenhouse gases than human activities. This is incorrect as these emissions; in the past, have all been absorbed in a balanced ecosystem by vegetation regrowth and the actions of Fungi and bacteria returning the elements bac to the soil and a natural recycling of nutrients. The new element in this closed system is the extra carbon humans are removing from underground coal, oil and gas reserves and placing them into the atmosphere which is the opposite of natural carbon sequestering. Present day volcanic activity has been at an abnormally low level so this cannot be an argument for global warming or short term cooling. Anyway increased volcanic activity that has been blamed for previous temperature fluctuations have occurred following ice cap meltdown and not the reverse.
* “Scientists are worried about losing funding, so they accept what the government line is.”
There is no evidence that undertaking research on climate change leads to government funding being boosted. In fact some climate related research positions have been axed in recent federal cuts especially in countries like Australia. The funding system in most countries is relatively transparent, with public funding for science projects. Climate change is being open to public scrutiny. The work is assessed alongside all other research work, and grants generally made based on quality of research, not on conclusions.
* “Climate skeptics are being silenced.”
Advocates of this claim are yet to come up with any evidence. Many Australian scientific researchers on climate change have said that the views of “climate skeptics” are given far more prominence in the media than their numbers and arguments merit.
Most Australian papers would have a 10 or at times 20 Climate skeptics to 1 supporter. This ratio is amongst the highest in the world yet highly informed members of the public and scientists are given far less media space and time. The evidence also points that climate skeptics ridicule supporters without facts and make derogatory remarks about the writer even though the writer has included facts from scientists. Skeptics also do not denounce any individual fact with facts and never have a model to back their arguments.
Rainfall:
The rainfall on this map is based on the years 1900 to 2010 where records were kept or from the time records were kept for an individual area. The map is subject to human error and the limited number of places where long term records were available. I believe it is still the best available for accuracy but does have limitations.
Rainfall is affected by topography even over short distances. This was well noted in the Coffs Harbour district where Coffs Harbour’s rainfall is 1705mm per annum yet Nana Glen which is only 20 kilometers away as the crow flies has an annual rainfall of 1400mm. In Nana Glen we recorded 1500m per annum yet our property is less than 2 kilometers from the official weather station on the opposite side of the valley. Another 500 meters to the north the properties received far more constant orographic precipitation which is not recorded as rainfall yet could add another 300mm to 500mm equivalent rainfall per annum and definitely affected the type of plant specie growing there.
The average for the second 50 year period was below the average for most centers compared to the first 50 year period through out Australia. The only exception is a narrow strip east of the Great Dividing Range from Newcastle to Ballina. I have included this map because it gives the average rainfall figures for an area but with Global Warming it may become obsolete within a decade or two.
The black & white dots represent some of the centers we checked for the mean annual rainfall after 1990. We based our figures on the Australian Meteorology department from 1900 to 1990.
Rainfalls given in the context for each plant are the absolute minimums a genetic strain of the plant will survive under in the wild in a severe drought year in its region. The second rainfall figure given is the average rainfall for the plant in its region for the past 110 years. It must be noted that garden specimens may not be from local gene pools and as such the plant may require less or more equivalent rainfall in water. Garden plants usually require far mere water than nature provides. Due to fertilizing which promotes greater leaf surface area over the plant and heavier flowering which both expire greater quantities of water.
Optimum growth would be between these figures and should not be taken as the norm
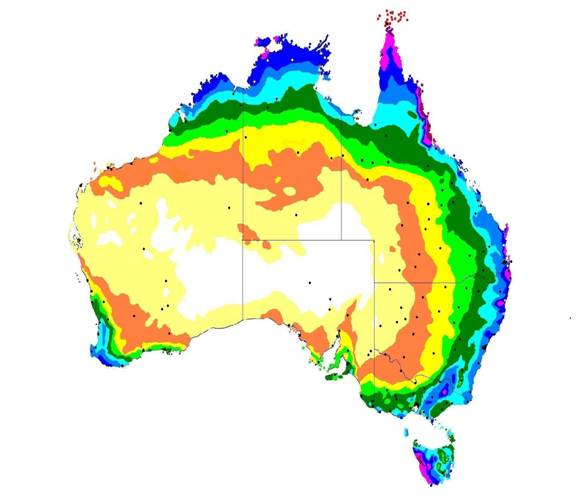
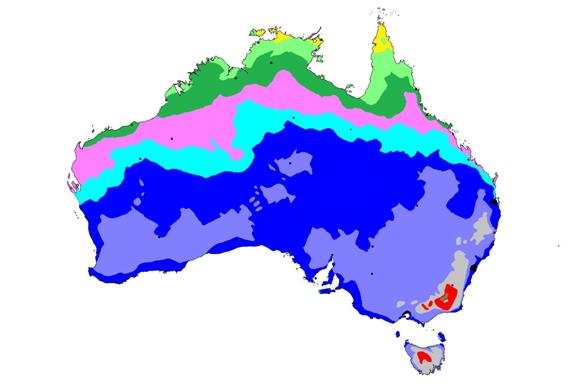
White 50mm to 200mm,
Cream 201mm to 300mm,
Tan 301mm to 400mm,
Yellow 401mm to 500mm,
Pale Green 501mm 600mm,
Green 601mm to 800mm,
Pale Blue 801mm to 1000mm,
Mid Blue 1001mm to 1200mm,
Deep Blue 1201mm to 1600mm,
Pink 1601mm to 2000mm,
Maroon 2001mm to 2400mm,
Red 2401mm to 3200mm plus.
| 1 | Murray | 2 | Darling | 3 | Murrumbidgee | |||||
| 4 | Lachlan | 5 | Campaspe | 6 | Yarra | |||||
| 7 | Goulburn | 8 | Latrobe | 9 | Ovens | |||||
| 10 | Snowy | 11 | Derwent | 12 | Shoalhaven | |||||
| 13 | Hunter | 14 | Macleay | 15 | Clarence | |||||
| 16 | Bogan | 17 | Macquarie | 18 | Namoi | |||||
| 19 | Barwon | 20 | Condamine | 21 | Warrego | |||||
| 22 | Dawson | 23 | Fitzroy | 24 | Mackenzie | |||||
| 25 | Isaac | 26 | Burdekin | 27 | Suttor | |||||
| 28 | Mitchell | 29 | Alice | 30 | Jardine | |||||
| 31 | Staaten | 32 | Flinders | 33 | Leichhardt | |||||
| 34 | Nicholson | 35 | Roper | 36 | Wilton | |||||
| 37 | Daly | 38 | Katherine | 39 | Victoria | |||||
| 40 | Ord | 41 | Drysdale | 42 | Fitzroy | |||||
| 43 | Margaret | 44 | De Grey | 45 | Fortescue | |||||
| 46 | Ashburton | 47 | Gascoyne | 48 | Murchison | |||||
| 49 | Swan/Avon | 50 | Blackwood | 51 | Coopers Creek | |||||
| 52 | Barcoo | 53 | Thompson | 54 | Diamantina | |||||
| 55 | Georgina | 56 | Finke | 57 | Palmer |
Altitudes, Rock Type, Rainfall & Temperatures
Altitude: Is taken at the post office when this is known or a landmark especially with mountains where the maximum height is recorded. Optimum growth would be maintained at altitudes between these figures or at the lower levels with plants growing close to sea level, thus the text figures should not be taken as the norm.
Rock Type: Is the main rock or soil formation within an area. Brisbane’s rock formations are even more complex and when metamorphic rocks are included the complexities are even more difficult to ascertain.
The author’s 40 hectare property at Nana Glen was so different coupled with topography that an amazing number of individual species were found on a single block and probably more than 3700 hectares that surround his present property at The Pinnacles. Nana Glen had Brown basalt, sandstone, shale, alluvial flats, leached podsolics soils, metashales, metasandstones, quartz and olivine.
The author’s knowledge of the different soil types is limited to surface observation not scientific research.
Rainfall: This is taken from the official Bom Weather station or a reliable source in smaller country locations. Figures can vary greatly within an area. Nana Glen west of Coffs Harbour is very typical of a valley situation where the rainfall varies by over 250mm a year from one side of the valley to the other yet the distance is less than 2 kilometers as the crow flies. The northern side of this valley also receives additional moisture from orographic precipitation where as the southern side receives very little. The rainfall figures below are the average rainfall figures for the locality where as the rainfall figures given in the text are the lowest rainfall the plants will receive during a severe drought and survive and the average rainfall in the highest known locality within its distribution. Optimum growth would be between these figures and should not be taken as the norm.
Temperatures: This is taken from the official Bom Weather station or a reliable source in smaller country situations. Figures can vary greatly within an area. The Pinnacles outside Grafton in NSW is very typical of a valley ridge situation where the Temperatures vary considerably yet the distance is less than 5 kilometres as the crow flies. Here the minimum typical winter temperatures can be as much as 6 degrees on a given day and summer temperatures can vary by almost as much and vary within an hour. The Ridge temperatures cool quicker in the evenings and warm quicker in the mornings but stabilise sooner. Ridge humidity was always lower than in the valley forming entirely different microclimates.
Temperatures recorded below are long term averages for the hottest month of the year in each location plus 3 degrees which is the normal highs for a district and coldest month less 3 degrees which is the normal lows for a district.
Note the author accepts discrepancies will exist in every location but I have done my best to include the greatest variation for each individual plant within its natural range described.
Different gene pools can play an important role in the plants actual survival as can its aspect and topography which have not been included unless it is essential for the plants survival.
Below is a list of the towns and cities which we relied on for mapping of weather conditions, temperatures and soil types which were used in the texts descriptions. This is far from a complete list but served its purpose with the limited resources available to the author and the time restraints on putting it all together. Again I thank you for your perseverance and support with any additional local information.
Location Altitude Main Geological feature Rainfall Temperature
| Adaminaby | 1,026m | Sandstone, Shale, basalt. | 865mm 28/0 |
| Adelaide | 18m | Granites | 545mm 42/2 |
| Albury | 54-310m | Granite / Alluviums | 702mm 44/2 |
| Alice Springs | 608m | Sandstone | 285mm 29/13 |
| Armidale | 982m | Granite | 805mm 26/2 |
| Atherton | 766m | Black basalt | 1419mm 30/9 |
| Atherton Tableland | 500m-1280m | Black Basalt | 1380mm 29/10 |
| Ballarat | 435m | basal / Granite | 691mm 32/3 |
| Ballina | 20m | Black Basalts | 1645mm 30/4 |
| Barcaldine | 268m | Sandstones | 504mm 40/3 |
| Barrington Tops | 1580m | Granite | |
| Batlow Town | 726m | Basalt, metamorphic, limestone | 930mm 29/-2 |
| Batlow plains | 1000m | Basalt, metamorphic, lime | |
| Bega | 21m | Basalt, metamorphic, Granite | 860mm 27/1 |
| Bendemeer | 816m | Granite | 670/1 |
| Bendigo | 225m | Basalt, | 506 30/2 |
| Ben Lomond | 1560m | Basalt | 1600 24/-6 |
| Berridale | 862m | Basalt | 700 28/-5 |
| Binna Burra | 645m | Black Basalt | 1700mm 27/2 |
| Blackheath | 1,067m | Sandstones | 1100mm 36/0 |
| Blackdown Tablelands | 945m | Sandstone | 1550mm 36/5 |
| Blayney | 874m | Sandstone | aaaaaa |
| Blue Mountains | 450-1200m | Sandstone | 1500mm 36/5 |
| Broken Hill | 315m | Sandstone, Basalt | 283mm 39/2 |
| Brisbane River | 0m-213m | Shale, Basalt, Metamorphic | 1400mm 38/4 |
| Broome | 12m | Sandstone | 615mm 42/6 |
| Bunya Mountains | 1330m | Basalt | 920mm 40/-2 |
| Cabramurra | 1461m | Granite | 1380mm 26/-8 |
| Camooweal | 235m | Dolomite Sand | 380mm 38/8 |
| Canberra | 580m | Granites | 616mm 33/-5 |
| Captains Flat | 848m | Granites | 880mm 33/-2 |
| Carnarvon Gorge | 770m | Sandstone sands | 616mm 33/-5 |
| Casino | 26m | Shale, Basalt & alluvial deposits | 1075mm 34/3 |
| Castlemaine | 320m | Basalt | 520mm 28/3 |
| Cathedral Rock | 1100-1580m | leoucoadamellite Granites | 1300mm 34/-2 |
| Childers | 109m | Black Basalt, Shale | 905mm 29/7 |
| Chinchilla | 303m | Sandstone sands | 590mm 34/0 |
| Clarence Valley | 0m-253m | Sandstone | 1600mm 32/2 |
| Clifton Grove | 855m | Sandstone | 1500mm 36 |
| Cloncurry | 186m | Sandstone, Black Basalt | 555mm 39/11 |
| Cobar | 242m | Sandstone, Black Basalt | 401mm 35/5 |
| Coen | 198m | weathered laterized sand | 1200mm 33/15 |
| Coffs Harbour | 21m | Accumulated Sands Black basalt, Grey podsolics | 1705mm 27/7 |
| Combyne Plateau | 750m | Black Basalt | 1500mm 36/-2 |
| Coolgardie | 465m | Sandstone, Black Basalt | 270mm 35/5 |
| Cooma | 793m | Granites | 540mm 30/-7 |
| Crookwell | 896m | Granites | 540mm 30/-7 |
| Cullen Bullen | 879m | Sandstone | 1500mm 36/5 |
| Dalby | 343m | Sandstone | 900mm 40/3 |
| Dandenongs | 620m | Black Basalt | 720mm 33/3 |
| Darwin | 28m | Sandstone | 1728mm 33/19 |
| Deepwater | 967m | Accumulated Sands, Podsolic Clays | 1155mm 27/14 |
| Devils Marbles | 482m | sandstone granite | 420mm 43/6 |
| Dinner Plain | 1,578m | Granites | 660mm 30/-4 |
| Dorrigo | 755m | Brown/Black Basalt | 2035mm 36/4 |
| Dubbo | 260m | Sandstone alluvials | 584mm 2/35 |
| Ebor | 1310m | Granite/Black Basalt | 2000mm 30/-5 |
| Einasleigh Uplands | 420m | Black Basalt | 2400mm 36/9 |
| Emerald | 173m | Sandstone | 536mm 31/9 |
| Emmaville | 886m | Granite/Black Basalt | 840mm 39/-2 |
| Eungella National Park | 750m | Black Basalt | 1607mm 36/4 |
| Falls Creek | 1200-1850m | Metamorphic, Granite, Basalt | 1265mm 25/-4 |
| Franklin River | 0m-951m | Granite | 2400mm 32/-2 |
| Gembrook | 350m | Black Basalt | 720mm 33/3 |
| Geraldton | 6m | Calcareous Aeolian Sands | 448mm 47/8 |
| Gilgai | 741m | Gilgai Vertisols | 448mm 40/2 |
| Glen Innes | 1,071m | Granite | 857mm 36/0 |
| Glenreagh Cliffs Tower Trig | 415m | Sandstone | 1075mm 34/2 |
| Grafton | 11m | Alluvial sandstones | 999mm 34/2 |
| Grampians | 1167m | Granite | 1075mm 34/-2 |
| Griffith | 129m | Sandstone, Basalt | 397mm 33/3 |
| Guy Fawkes River | 1410m | Granite, Basalt | 960mm 32/-1 |
| Guyra | 1,336m | Granite | 921mm 33/0 |
| Halls Creek | 470m | Basalt | 589mm 40/7 |
| Hazelbrook | 675m | Granite, Basalt | 673mm 33/2 |
| Herberton | 913m | Black Basalt | 2400mm 36/9 |
| Horsham | 110m | Alluvial Sands | 375mm 37/3 |
| Hughenden | 324m | Basalt/Soft Sedimentary | 493mm 37/8 |
| Inverell | 582m | Granite | 800mm 39/6 |
| Jindabyne | 918m | Granite | 540mm 30/-77 |
| Kakudu NP | 0m-520m | Sandstones | 1750mm 33/19 |
| Kalgoorlie | 400m | Granite | 290mm 36/4 |
| Katherine | 108m | Sandstone | 1136mm 38/13 |
| Katoomba | 1,025m | Sandstone | aaaaaa |
| Kimberley | 314m | town | 1270mm 40/16 |
| Kimberley Plateau | 938m | aaaaaaa | aaaaaa |
| Kingaroy | 433m | Black basalt | 780mm 39/1 |
| Kosciosko National Park | 1600m-2228m | aaaaaaa | aaaaaa |
| Kununurra | 47m | Sandstone | 840mm 39/15 |
| Lakewood Estate | 970m | aaaaaaa | aaaaaa |
| Lithgow | 916m | aaaaaaa | aaaaaa |
| Lord Howe Island | 875m | aaaaaaa | 1488mm 26/13 |
| Macdonnell Ranges | 699m | aaaaaaa | 286mm 30/10 |
| Mackay | 11m | aaaaaaa | 1607mm 38/4 |
| Macpherson Ranges | 1000m | Black basalt | 1600mm 28/3 |
| Malanda | 735m | aaaaaaa | aaaaaa |
| Mallacoota | 35m | aaaaaaa | aaaaaa |
| Mareeba | 400m | Black Basalt | 920mm 40/4 |
| Maryborough | 24m | aaaaaaa | 1155mm 27/14 |
| Medlow Bath | 1,064m | aaaaaaa | aaaaaa |
| Mildura | 52m | Accumulated sands and silts | 268mm 33/4 |
| Millaa Millaa | 832m | aaaaaaa | aaaaaa |
| Millerran | 406m | Sandstone | 700mm 33/3 |
| Millthorpe | 969m | aaaaaaa | aaaaaa |
| Mossman | 14m | Black basalt | 2013mm 28/16 |
| Mount Buffalo | 1723m | Granite | 1393mm 27/-9 |
| Mount Carbine | 360m | aaaaaaa | aaaaaa |
| Mount Gambier | 40m-190m | Basalt-Limestone | 705mm 44/5 |
| Mount Hotham | 1862m | Granite | 1450mm 28/-9.3 |
| Mount Isa | 360m | Sandstone | 470mm 37/9 |
| Mount Lewis | 1210m | metamorphic-granites | 2500mm 24/8 |
| Mount Molloy | 476m | aaaaaaa | aaaaaa |
| Mount Tom Price | 747m | Shale | 387mm 41/4.5 |
| Mount Victoria | 1,071m | aaaaaaa | aaaaaa |
| Mount Zero | 350m-1050m | Granite | aaaaaa |
| Mukinbudin | 313m | Sandstone | aaaaaa |
| Nana Glen | 45-360m | Sandstone, metashales, alluvials | 1480mm -2/39 |
| Narrabri | 210m | aaaaaaa | aaaaaa |
| Nimmitabel | 1,082m | aaaaaaa | aaaaaa |
| Norfolk Island | 371m | aaaaaaa | 1293mm 26/13 |
| Oberon | 1,103m | aaaaaaa | aaaaaa |
| Orbost | 41m | aaaaaaa | 757mm 27/5 |
| Orange | 869m | aaaaaaa | aaaaaa |
| Ord River | 521m | Sandstone | 840mm 39/1 |
| Paluma National Park | 192m | Granite | aaaaaa |
| Perisher Village | 1,721m | Granite | aaaaaa |
| Pinnacles NSW | 180m | Sandstone | 1200mm 33/2 |
| Portland | 944m | Accumilated Sands | aaaaaa |
| Port Lincoln | 32m | Quartzites and calsilicates | 375mm 26/7 |
| Port Macquarrie | 8m | Accumilated Sands Black Basalt | 1535mm 26/7 |
| Ravenshoe | 912m | Black Basalt | aaaaaa |
| Rockhampton | 13m | Granite | 800mm 32/9 |
| Spring Hill | 947m | aaaaaaa | aaaaaa |
| Stanthorpe | 800m | Granite | 766mm 30/-3 |
| Sydney | 20m | Sandstone | 1200mm 36/4 |
| Tamworth | 404m | Granite, Basalt | 673mm 33/2 |
| Taralga | 842m | aaaaaaa | aaaaaa |
| Tennet Creek | 377m | Sandstone | 474mm 40/10 |
| Tenterfield | 851m | Granite | 853mm 30/-3 |
| Thredbo Village | 1,447m | Granite | aaaaaa |
| Tiboorurra | 70m-310m | Granite | 231mm 37/5 |
| Tingha | 786m | aaaaaaa | aaaaaa |
| Tolga | 759m | Granite | 960mm 32/-1 |
| Toowoomba | 600m | Black Basalt | 944mm 39/-4 |
| Torrington | 850m | Granite | 996mm 41/-9 |
| Townsville | 286m | Granite | 1140mm 34/8 |
| Tumbarumba | 620m | aaaaaaa | aaaaaa |
| Tumit | 280m | Basalt | 650mm 16/-4 |
| Uralla | 1,004m | Granite | aaaaaa |
| Victoria River N.T. | 361m | aaaaaaa | aaaaaa |
| Walcha | 1,047m | Granite | 960mm 32/-4 |
| Wallangarra | 880m | aaaaaaa | aaaaaa |
| Weipa | 20m | Eroded lateritic clays | 2075mm 37/15 |
| Wiluna | 503m | Red sands | 268mm 41/2 |
| Wollomombi Falls | 930m | Granite | 870mm 35/-4 |
| Wallerawang | 898m | aaaaaaa | aaaaaa |
| Warwick | 477m | South Granite, North Black basalt | 687mm 40/-7.2 |
| Wentworth | 871m | aaaaaaa | aaaaaa |
Looking around Australia even since 2019 the east coast had one of its severest droughts followed by 2 unusually wet seasons, which has led to unprecedented flooding.
Students and the present young generation deserve better a lot better from our politicians.
Further Comments from Readers:
All information is included in good faith and has been thoroughly researched prior to printing. The website or the author does not warrant or guarantee the accuracy of any information on these pages, nor does the website or the author accept any responsibility for any loss arising from the use of the information found within. The views and opinions are strictly those of the author or those members who chose to actively participate in the contents herein.Membership agreement prohibits any reproduction, copying; other than for personal use, redistribution, electronic, paper or otherwise, including on the World Wide Web, in whole or in part, is strictly prohibited without the express written permission of the author or member contributor.
“Hi reader, it seems you use The Bible of Botany a lot. That’s great as we have great pleasure in bringing it to you! It’s a little awkward for us to ask, but our first aim is to purchase land approximately 1,600 hectares to link several parcels of N.P. into one at The Pinnacles NSW Australia, but we need your help. We’re not salespeople. We’re amateur botanists who have dedicated over 30 years to saving the environment in a practical way. We depend on donations to reach our goal. If you donate just $5, the price of your coffee this Sunday, We can help to keep the planet alive in a real way and continue to bring you regular updates and features on Australian plants all in one Botanical Bible. Any support is greatly appreciated. Thank you.”
In the spirit of reconciliation we acknowledge the Bundjalung, Gumbaynggirr and Yaegl and all aboriginal nations throughout Australia and their connections to land, sea and community. We pay our respect to their Elders past, present and future for the pleasures we have gained.